The selection of colors in data visualization is not just a matter of aesthetics but a vital tool for conveying quantitative information. Properly chosen colors accurately represent the underlying data, in contrast to many commonly used color schemes in visualization that distort the relationships between data values.
Describing colors
Color has three main attributes: hue, saturation, and value.
Colors like red, green, and blue are commonly referred to as hue.
Saturation refers to the strength or intensity of a color. When a color has higher saturation, it means that the hue of the color is more intense. For example, a red color will become more vibrant and pure (less pinkish) as its saturation increases.
Value describes the brightness or darkness of a color. If you want to make a color darker, simply incorporate black into it.

Warm and cool colors
Warm and cool colors can easily be distinguished based on their location on the color spectrum. Warm colors are found in the red area, which includes shades of red, orange, yellow, and brown. On the other hand, cool colors are located on the blue side of the spectrum and consist of blue, green, and neutral gray hues.
Colors that are warm in tone tend to look bigger than cooler colors. This means that if you use equal amounts of red and blue, the red will visually dominate. Additionally, warm colors seem closer, while cool colors appear to be further away.

Specifying colors
The way colors are specified varies depending on the application.
CMYK
When it comes to producing high-quality color printing, printers rely on four inks - cyan, magenta, yellow, and black. Although theoretically, combining cyan, magenta, and yellow inks should result in black, in reality, it produces a muddled brown color. That's why printers use the fourth ink, black, to achieve a sharp and solid black. The specific percentages of these four inks determine the colors that will be produced.
For example, CMYK (100, 30, 0, 0) will print a color with 100% cyan, 30% magenta, 0% yellow, and 0% black.

RGB
On TV and computer screens, colors are displayed using a precise combination of red, green, and blue lights. The resulting effect of the three lights working together creates white light. When crafting images for screens, colors are determined based on the quantity of red, green, and blue utilized. Each color component ranges from 0 to a maximum value of 255.
For example, the full red color is: RGB (255, 0, 0)

Hex value/hex triplet
A six-digit hexadecimal number or triplet defines colors in web design using #RRGGBB format. Each color component ranges from #00 to #FF.
Example: Red RGB (255,0,0) #FF0000 Green RGB (0,255,0) #00FF00 Blue RGB (0,0,255) #0000FF
Color palettes
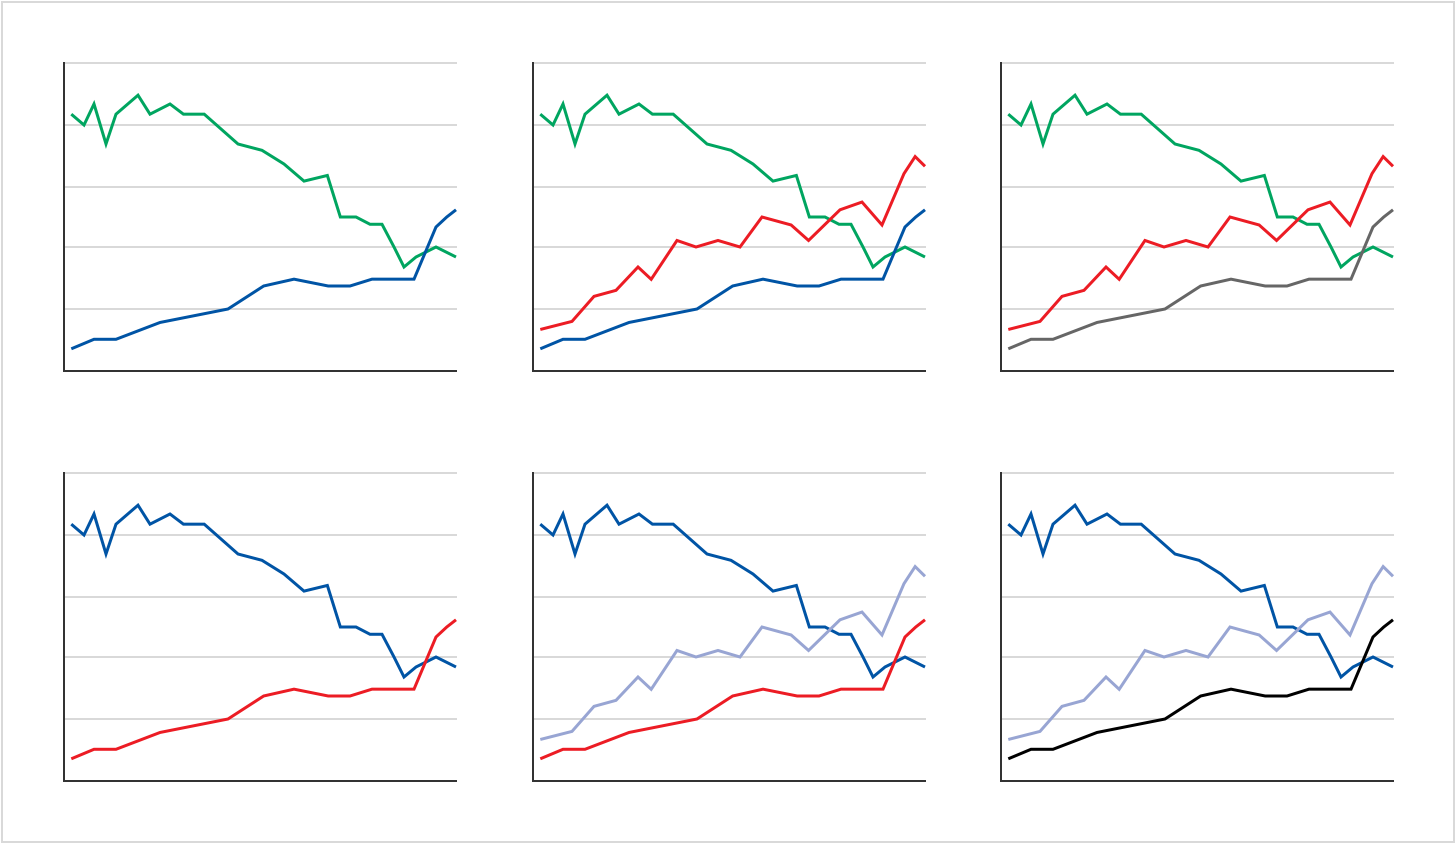
A chart's color palette should consist of basic colors and three to five shades of each hue to use fewer colors and avoid distraction. Consistency in using the same palette throughout the presentation extends professional coordination.

Color in charts
When creating charts, it's important to use colors tastefully. Refrain from overwhelming the viewer by using too many colors at a time. Instead, opt for harmonious combinations, such as shades of the same color or adjacent colors on the color wheel. It's also okay to limit the use of color or even avoid it altogether if it's not needed. Remember to approach color choices with the same care and consideration when welcoming guests into your home.
When creating charts, it's important to strategically choose colors that will effectively compare and contrast your data. Each color change represents a significant change in information or an additional layer of data. Therefore, the information presented should dictate the selection of every color used for the charts. Avoid arbitrary color choices to ensure clarity and accuracy in the representation of your data.
To help readers compare data easily, using one color consistently to represent each variable is best. Avoid using multiple colors to represent the same data.

To emphasize the main point, it's possible to use a contrasting color or a darker shade.
When creating a multiple-bar chart, it's important to avoid using contrasting colors or colors that are opposite each other on the color wheel. This can distract the reader and take away from the presented data. Instead, stick to using different shades of one color or colors that are on the same side of the color wheel. This will keep the chart looking clean and easy to read, allowing the reader to focus on the information conveyed.

Avoid using alternating light and dark colors in the middle when creating a color scale. This can make it difficult for the eyes to compare shades accurately. Instead, the scale should gradually progress from the lightest to the darkest or vice versa, regardless of color. You can convert the scale to black and white to test the smooth progression.

It is generally recommended to avoid using colors that are thematically associated with certain holidays or events, such as red and green, for Christmas sales. Instead, colors should reflect the tone or mood of the message being conveyed. For example, deep blue may be used to convey a conservative tone, while bright colors can be used to create a cheerful vibe.

It is not advisable to use the color red to represent positive numbers in a bar chart as it is commonly associated with losses in business. Instead, using red bars to represent negative earnings is more effective.

Color chart templates
When choosing colors, use different shades of the same color or colors that are adjacent on the color wheel.

Use bright colors like red and black to emphasize important lines.
Consider using a different color or darker shade to make a certain section stand out.

Coloring for the color blind
Charts use color changes to signify changes in information or to add layers of data. If color is used to convey information, but the reader cannot see it, then the translation of information will be severely impeded. A chart can only be considered successful if a reader can access, read, and understand its content. Therefore, color must be used effectively and appropriately to convey the information accurately.
About 10% of men have some form of color blindness, as per the National Institute of Health. There are two major types of color blindness: the most common form makes it difficult to distinguish between red and green, while the other type makes it difficult to distinguish between blue and yellow.
Color combination pitfalls
Color combinations like red/green or blue/yellow are situated on opposite sides of the color wheel. While the color hues themselves are vastly different, they can still appear similar in value or lightness. The intense color can overpower the underlying data and even cause the colors to vibrate when used in larger quantities. These color combinations can be distracting for readers with normal color vision. Moreover, the lack of contrast in lightness makes it virtually unreadable for color-blind users.
Legends that rely solely on color to convey information can be a burden for general users and incomprehensible for color-blind readers. Legends are often challenging for most readers since our eyes cannot immediately differentiate between small color swatches, particularly when there is not enough contrast in color and value.

Strategies for selecting effective colors
1. Set type in black
For the highest contrast in your text, it's best to go with black. Black type on a light background is the most effective choice. When it comes to color, even readers with normal color vision may find it difficult to read. If you must use a dark background for design reasons, it's recommended to opt for white type instead of color type.

2. Label directly on chart elements
Direct labeling is helpful for all readers. If you must use a legend, be sure the colors have high contrast in values.
Using darker shades to highlight a bar or a line is a common practice to draw attention to specific data points. However, it's important to keep in mind that not everyone may be able to distinguish between different shades of color clearly. You can also set the label in bold typeface to ensure that all information is conveyed clearly. For instance, in the pie chart below, segment B is highlighted using a darker color and bold typeface for the label. This redundant approach helps make the information clear and easily understandable, both with and without color.

3. Ensure high contrast in values
Using a different color to differentiate other chart elements or signify a change in data is advisable. However, use a lighter or darker shade of that second color when doing so. This creates a sufficient contrast in values, which makes the chart more accessible to all readers. By differentiating lightness or darkness, it is easier for the eyes to distinguish between the different chart elements.

4. Final test: convert to grayscale
Print the chart in black and white or grayscale to test whether it has sufficient contrast. Colors are only effective if the graph is legible in black and white.

Color scale application
Investors use a heat map as a tool to identify new opportunities in changing markets, which allows them to take advantage of them. By comparing a series of heat maps, it's possible to reveal how the prices of different securities move together. This can help investors make informed decisions about where to invest their money.
Example: During a trading day, the amount of fluctuation in the value of a stock index option.
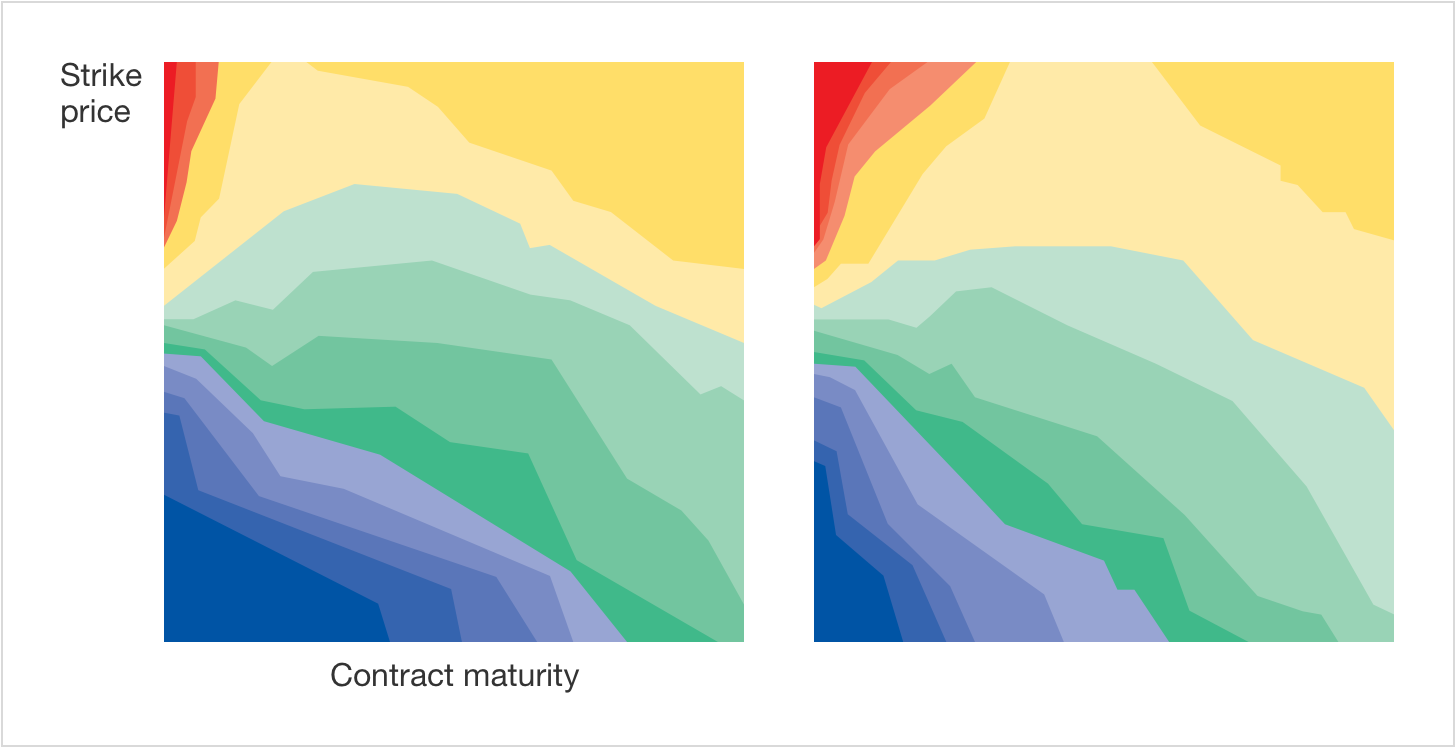
Color is the third dimension used to display the relationship between three variables on a flat surface. These heat maps illustrate how changes in options volatility depend on contract maturity and strike price over time.

Color gradients can visually represent any continuous range of values.
Tools for using colors
There are many online tools that can assist you in selecting and testing colors for your data visualizations. We will highlight some of the simplest tools to help you get started with color choices.
ColorBrewer
ColorBrewer is a popular resource for selecting color palettes. It offers a variety of palettes of different types. However, some of these palettes may be unsafe for people with color blindness. You can check the safety of a color set by looking at the eye icon located above the color codes panel. The icon will display a question mark or an X if the color set has the potential to cause perception difficulties.
Data Color Picker
The Data Color Picker is a tool that helps generate sequential and diverging color palettes. The "Palette" tab is ideal for creating multi-hue sequential palettes, as it interpolates between endpoints. However, it may not be suitable for qualitative palettes, as some hues in the color wheel may be left out during the interpolation.
Chroma. js Color Palette Helper
The Chroma.js Color Palette Helper is a more advanced tool than the Data Color Picker. It comes with additional options for correcting lightness, using bezier interpolation, and slightly more complex input of color values. However, it offers more freedom in setting multiple stop-points for the algorithm to fit a palette. Additionally, the tool includes a color blindness simulator on the same page, which highlights the most common types of deficiency where issues may occur.
Color Thief
There are not many easy-to-use tools available for creating qualitative color palettes, unlike sequential or diverging palettes. Although I Want Hue and Colorgorical are both useful for generating random palettes quickly, they can be challenging to customize.
A fun way to create a good color palette is to take inspiration from images and screenshots with pleasing natural color combinations. There are many tools available for this, but one of the easiest and most effective is Color Thief. It automatically extracts a range of colors from uploaded pictures. However, remember that these colors may not be suitable for direct use in visualization. You may need to make some adjustments to ensure the colors you choose work well together in a visualization context, even if they provide an inspirational starting point.
Summary
This article briefly overviews how color can be effectively used for data visualization. Different types of color palettes, such as qualitative, sequential, or diverging, should be used depending on the data type being represented. It is important to ensure that the colors used are meaningful and consistent. Additionally, it is important to consider colorblindness when creating visualizations to improve accessibility. When presenting findings to others, it is important to carefully consider color choices, as a good set of colors can make it easier to deliver your desired message to your audience.
The following article from the Data Visualization series will discuss lines in charts. Stay tuned and subscribe to our mailing list to make sure you get the next article on the Data Visualization topic.
If you missed the previous two articles from the series, you can read them here: