

When you create a chart, you analyze the data and choose the format that presents complex information most effectively. When used appropriately, the principles outlined in this article can elevate your chart from average to impactful.
In this chapter, we will be focusing on good and bad chart choices. Each topic has been organized to highlight both the negative and positive practices. While some choices are clearly right or wrong, others are either more effective or simply lack essential information. For instance, consider reading a pie chart in the same way you would read a clock. The most logical approach is to position the largest segment of the pie at the 12 o'clock position on the right side. This emphasizes its significance.
Height and weight
Lines are ideal for displaying continuous data series over time, such as stock prices and index values. They are well-suited for illustrating trends, accelerations or decelerations, and volatility, including sudden peaks or troughs.
Unlike a bar chart, a line graph does not require a zero baseline. For example, plotting a range in the thousands from a zero baseline would make it hard to discern daily changes.

Misrepresenting the trend
The main objective of a line chart is to demonstrate a trend. However, selecting a y-axis scale that results in a horizontal line completely goes against the intended purpose of the chart. Conversely, an overemphasized line creates an unnecessary drama that may not accurately represent the data.

The right height – two-thirds of the chart area
When creating a chart, it is important to choose the right y-axis scale. Aim for the height of the fever line to occupy roughly two-thirds of the chart area. This will help ensure that the chart is clear and easy to read. Additionally, it is important to include relevant reference points in the scale. These will help you determine the range of the chart and make it less arbitrary. For example, if you are creating a stock chart, be sure to include its 52-week high and low in the range.

Missing the twists and turns
A line chart is a visual representation that can effectively display a vast amount of data in a small space. A thick line can obscure the data points between peaks and troughs, whereas a thin line fades into the background.

When creating a line chart, it is important to remember not to shade below the line unless the chart has a zero baseline. This is because filling in the area below a line turns a line chart into an area graph. Just like a bar chart, an area graph measures discrete quantities. If you color below a fever line that does not start at zero, you will truncate the data and potentially misrepresent the information. Therefore, it is recommended to avoid shading below lines unless a zero baseline is present.

The right weight – visible with details
To ensure the fever line is easily distinguishable from the grid lines, use a thicker weight for the fever line. However, the fever line should still be thin enough to depict the twists and turns of the line clearly. Keep the grid lines thin and make the zero baseline slightly thicker than the other grid lines.

Y-axis increments
It is advisable to avoid starting a y-axis with values close to zero, even though a line chart does not have to include a zero baseline. Add a couple of grid lines to cover the zero baseline if needed.

While one of the charts above uses acceptable y-axis increments, the fever line starts at 6, which exaggerates the upward trend.

Use round numbers (0, 5, 10, 15, 20, etc.) to make it easy for readers to understand data points between grid lines.
Clean lines, clear signal
Even if color is available, only plot up to four lines on a single chart. You won't find a pot of gold at the end of that rainbow.
No spaghetti lines
To distinguish between different lines, it is tempting to use all the dashed lines and shape markers in the graphics software toolbox. However, this only obscures the lines that carry the information.
You can use solid lines only if the chart has four or fewer lines. Varying weights and shades differentiate the lines more effectively than distracting patterns and markers.

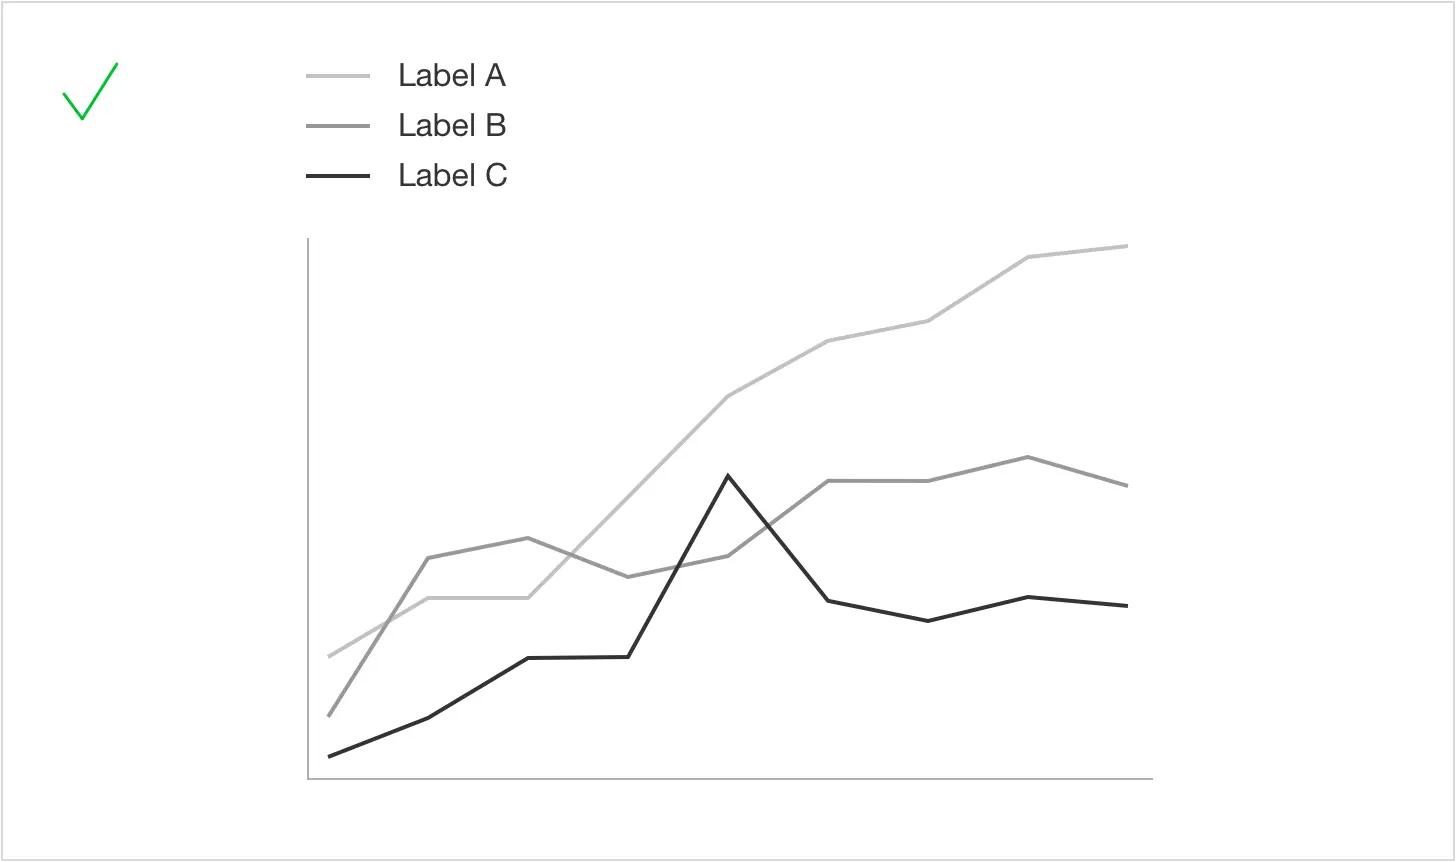
Four or fewer lines

When creating a chart with multiple lines, keeping the maximum number of lines to three is important. You can include four lines if the lines do not intersect at many points. It's important to select the three or four data series that will show a significant difference. Adding more lines does not necessarily improve the chart. A multiple-line chart aims to compare and contrast different data series. If you add too many lines, the chart becomes confusing and defeats its purpose.
Panel of charts

When there are four or more data series, an array of individual charts can be used to display a pattern. This enables better comparison among all the lines, preserving the clarity of each individual line.
In a multiple-line chart with a black-and-white color scheme, the line with the darkest shade should indicate the most important data series. On the other hand, in a color chart, the most important line should be of one color, preferably red, and the other lines should be of different shades of a second color, such as blue. Using different colored lines could be confusing and illegible for color-blind readers.
Legends and labels
Avoid overwhelming a line with a large block of text when labeling it. Keep labels concise, using no more than one short sentence.

Avoid labeling at long distance
A legend positioned away from the line forces the reader to cross-reference with the key, increasing their workload.
Readers struggle to focus on the relationship between lines while darting their eyes back and forth from the legend to the chart.


Label the lines directly
A legend should not be in a small box in the corner of the chart. Direct labeling allows readers to identify lines quickly and compare and contrast patterns.


Legend should only be used when space is limited and lines extensively intersect. The order of the legend should match the ranking of the end points as they are the most current data points.
Left-right y-axis scales
When comparing two data series that measure the same kind of quantities, such as stock prices, avoid using left-right scales. Instead, using a comparable scale or chart of the percentage changes to compare the two series is better.
Do not mix apples and oranges
It is not recommended to use one scale on the left and another on the right for two uncorrelated series, even if it saves space.
For example, revenue is plotted against a market index on a double y-axis scale.

It's arguable that the stock market affects sales, but the relationship is not direct or quantifiable. Superimposing the two variables only adds confusion to your chart.
Moving in tandem
To illustrate how two directly related series move together, using left-right y-axis scales can be beneficial.
The chart below illustrates that an increase in market share has not resulted in revenue growth.

It is important to label the scales clearly to prevent any misunderstandings or confusion.
It is important to use the correct chart type for each series. Use lines for continuous data and bars for discrete quantities. Do not deviate from this rule for stylistic reasons. However, if both data series require a chart with vertical bars, you can convert one of them to a line.
It is advisable to use left-right scales cautiously since the scale chosen can alter the apparent relationship between the two lines.

Comparable scales
When determining the ranges of comparable scales, avoid using awkward increments on the y-axis.
Biased comparison
Whenever two or more charts are placed together, the reader tends to compare and contrast the lines. Plotting the data series on incomparable scales provides an inaccurate representation of the data.

Both stock A and stock B increased by $20. Stock A doubled in value, while stock B increased by 20% in the same period. Yet the pictures show that both lines have the same slope.
The readers need to calculate the percentage changes of both lines to draw the correct conclusion.
The above charts falsely imply that stocks A and B have similar investment returns.
Fair comparison
To effectively compare two or more sets of data, it is important to use scales that are comparable. This means that the scales used for each set of data should be consistent and match each other.
From the slopes of the lines, the reader can easily determine the relative performance. The y-axis ranges should represent the same percentage change on both charts.

In this example, the range of the y-axis scale from $20 to $40 is the same percentage change as from $100 to $200.
Although both stock A and stock B increased by $20, investors in stock A are five times better off than investors in stock B during that period.
It is best to plot data series on the same chart when they have similar ranges to allow for easy and immediate comparison.
Summary
The line chart is one of many different chart types that can be used for visualizing data.
A line chart, which is also called a line graph or curve chart, is a visual tool used to illustrate data points that are connected by straight lines. This type of chart is particularly useful for showing trends, changes, and relationships in data that occur over a continuous interval, often time. Each data point represented on the chart corresponds to a specific category or time point. The lines connecting these points enable viewers to identify patterns and variations in the data easily.
The following article from the Data Visualization series will discuss vertical bars in charts. Stay tuned and subscribe to our mailing list to make sure you get the next article on the Data Visualization topic.
If you missed the previous three articles from the series, you can read them here:

