
Considering the impact of big data on the development of various industries, it's no wonder this market is projected to reach $665 billion by 2029. The ability to effectively process vast quantities of information drives innovation and decision-making. However, getting these insights is impossible without a convenient visual representation.
When creating user interfaces for big data applications, designers must ensure the software becomes more accessible and understandable to users of varying expertise levels. A well-made UI simplifies complex information through intuitive layouts, visualizations, and navigation, enabling users to focus on analysis rather than figuring out how to use the software.
Interested in how to do that? Let's examine the best tips for designing user interfaces for big data based on our experience and some real-life case studies from large corporations. With this guide, you'll learn how to build user interfaces for big data in no time!
6 expert tips for creating user interfaces for big data applications
1. Use skeleton screens
Skeleton screens are a design pattern that enhances the user experience during the loading time of an application or website. Instead of showing an empty screen or a loading spinner, skeleton screens provide a blank version of the page into which information gradually loads.
A skeleton screen mimics the layout of the actual page, with placeholders like gray blocks or shimmering lines signifying where the actual data will appear. The visual structure of a skeleton screen is intentionally kept simple and indicative of the content that will soon appear on the screen, offering a preview of the data layout and making the page more intuitive to navigate.

Using skeleton screens in big data user interfaces has multiple benefits:
Users perceive the loading time to be shorter due to the visual cue that content is coming. This psychological trick, known as progressive loading, keeps users engaged, reducing their frustration and page abandonment rates.
Skeleton screens create a sense of anticipation, preparing users for the content that will soon appear. This makes the interface feel faster and more responsive. This approach manages user expectations in applications with large datasets and maintains engagement even during long processing times.
Skeleton screens gradually introduce information, making it more manageable. It's instrumental in dashboards, reporting tools, and other data-intensive applications with complex, time-consuming queries and large data volumes.
Skeleton screens are an excellent choice for creating engaging UI designs for big data apps. They give your software a modern look while simultaneously driving user engagement, which is essential for leaving a positive impression.
2. Clarity over style
If you plan to build effective UI design for big data, you must prioritize clarity over style. The goal of any user interface in big data applications is to present vast amounts of information in an understandable, navigable, and actionable way. Therefore, you need to focus on clarity, efficiency, and simplicity.
Modern designs have many ways to present data at their disposal: static and interactive infographics, animations, 3D visualization, color-coded blocks, and many others. However, usually, you can do with just these four data presentation tools:
Line charts for demonstrating continuous data.
Tables for providing summaries and comparisons.
Histograms for demonstrating variables and distributions.
Bar graphs for categorical data and comparisons.
Limiting the number of options means users understand how your app works quicker, allowing them to adapt more quickly. For instance, we can look at PubNub, an analytical application that does a great job with its good-looking and straightforward data representation.
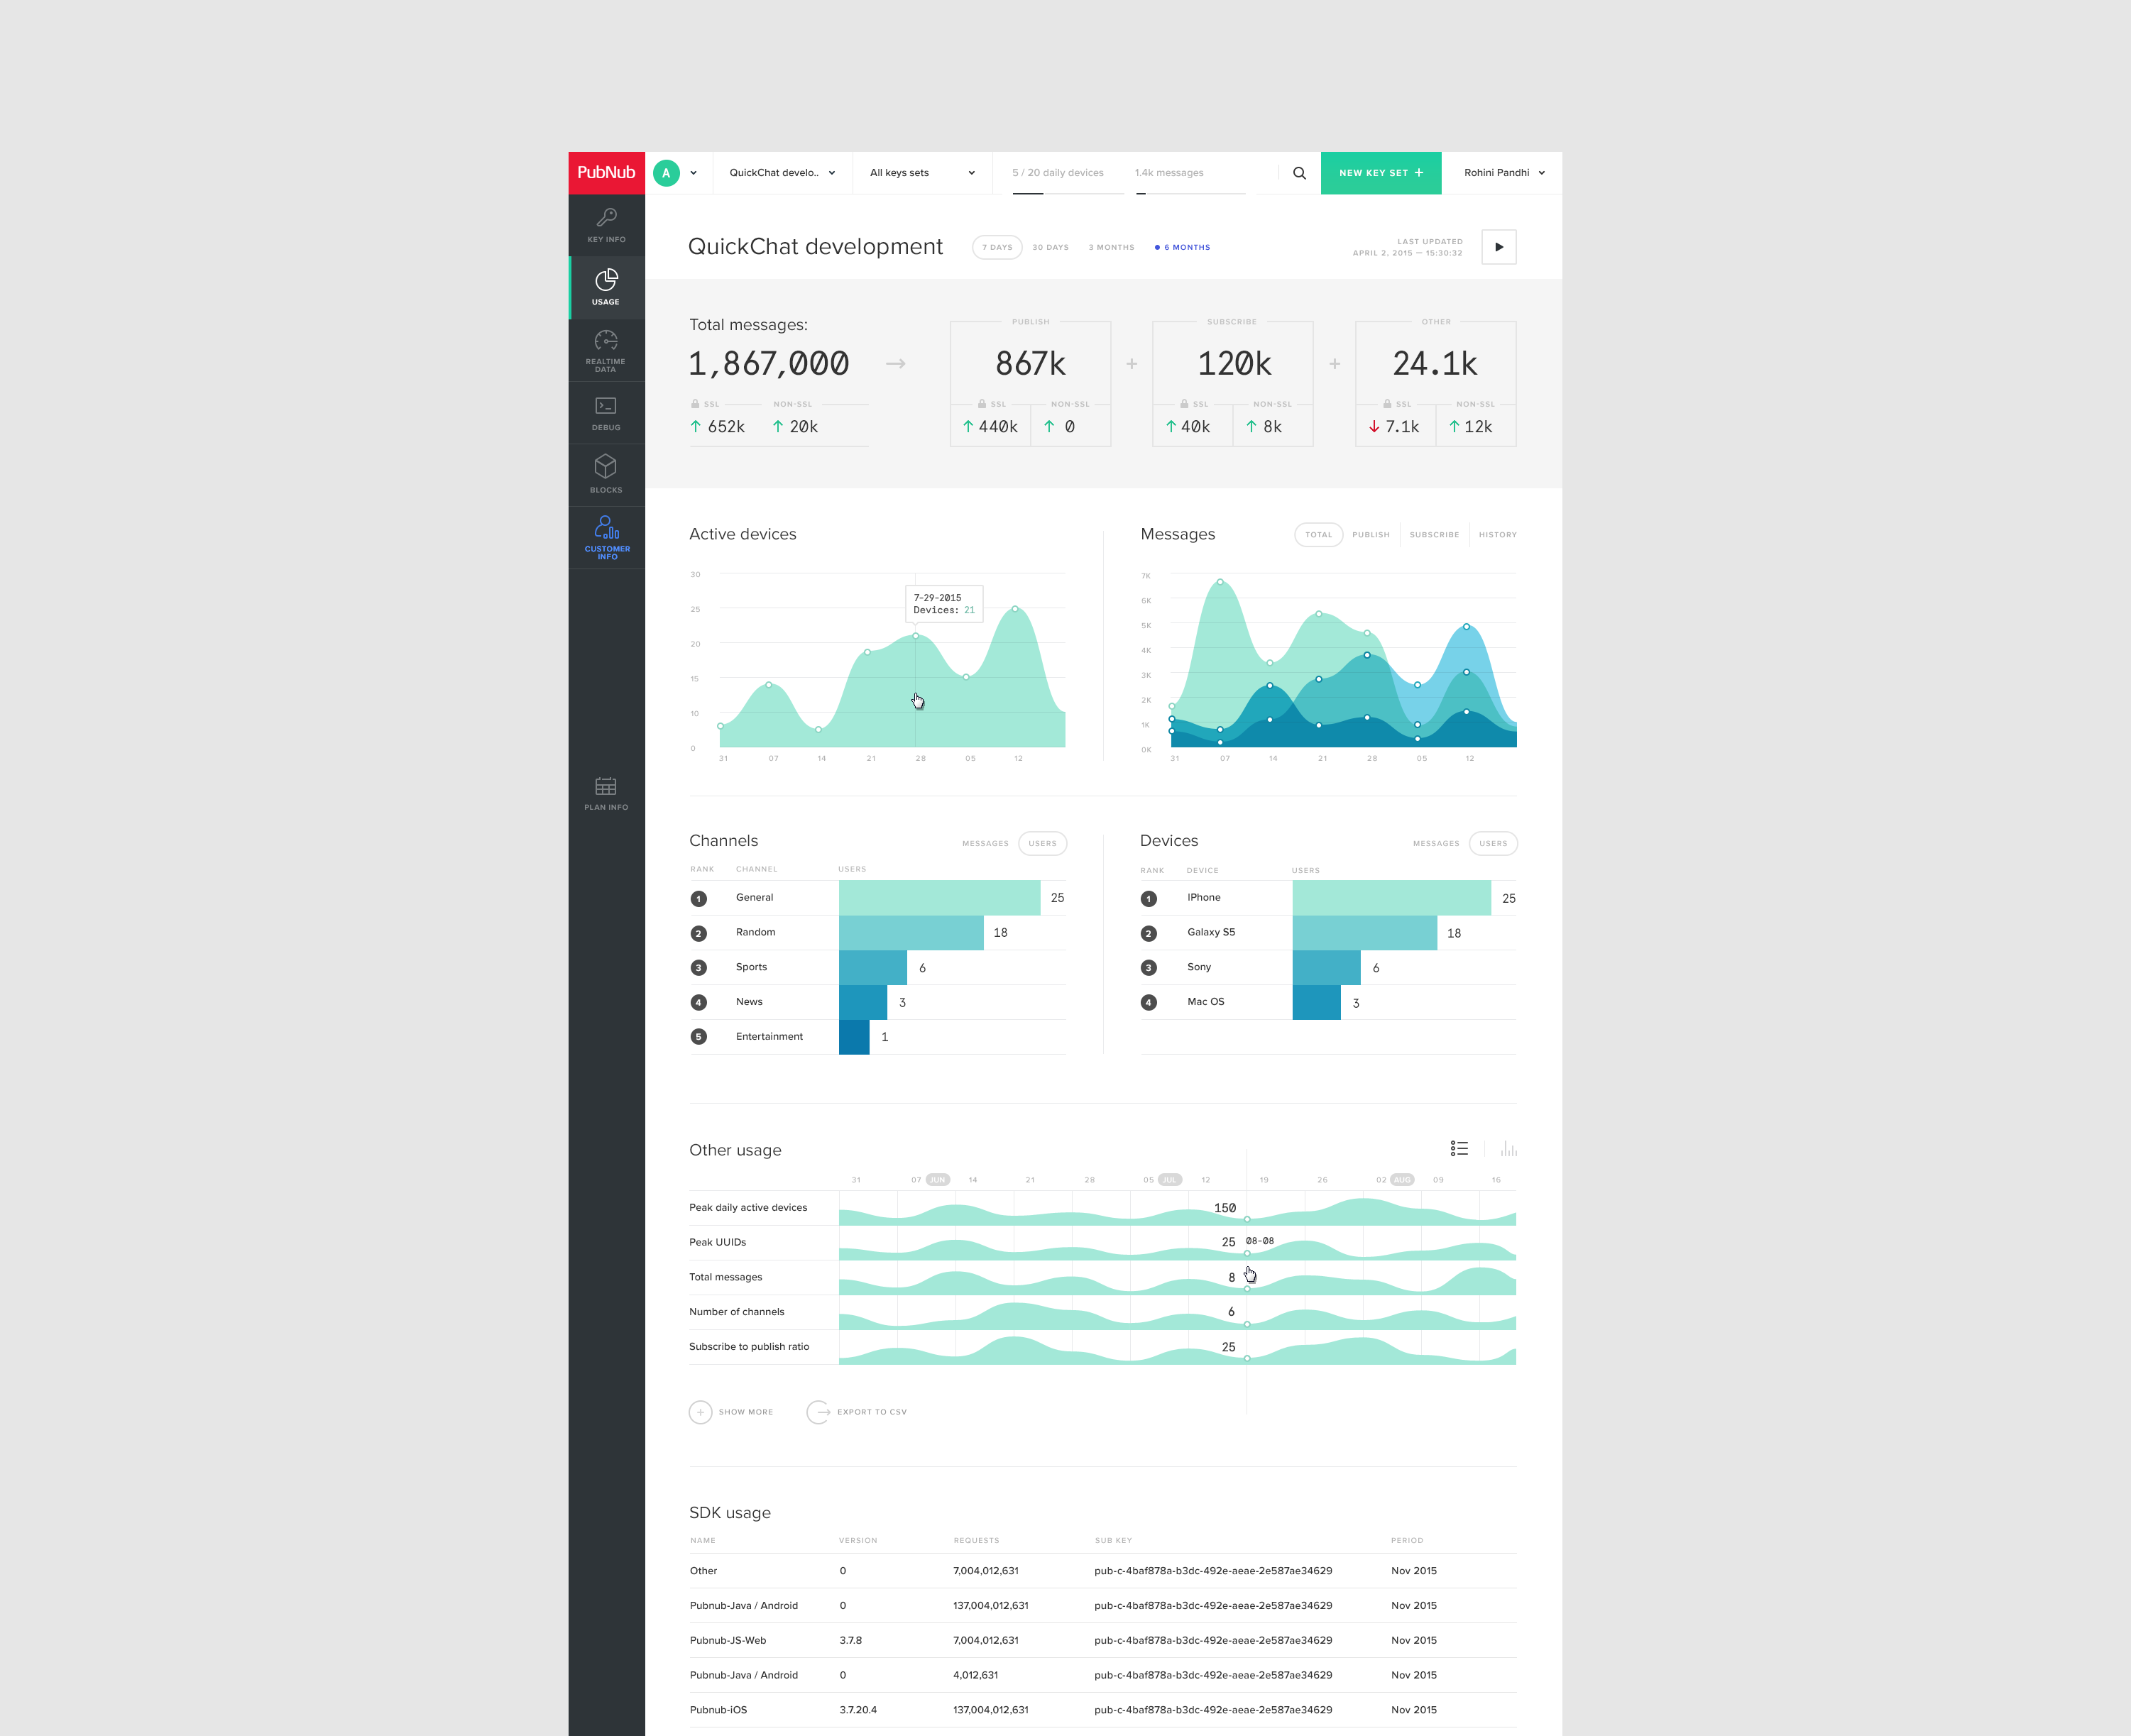
When creating UI for big data, you can find multiple examples from popular applications on Dribbble or Behance. These examples help you understand how data-driven web applications balance clarity and style in user interfaces.
3. Remember data hierarchy
Designing UI for big data requires creating effective, intuitive, and user-friendly data hierarchies. To achieve this, you must prioritize the right metrics and ensure the most critical data is displayed first. Any additional information can be introduced later, depending on the user's needs.
A clear hierarchy helps users assess the importance of different data sets and understand the relationships between them at a glance. This visual component is crucial for tasks that require comparison, analysis, and synthesis of data from various sources. By presenting data in a way that reflects its relevance and interconnections, you can make an interface far more accessible.
4. Performance optimization
Designing user interfaces for big data also requires considering the technical aspects of the software. A well-optimized design doesn't keep the user waiting for a long time, so ensure everything works as quickly and fluently as possible.
One of the better techniques to optimize the performance of your UI is bucketing. Under this approach, you divide large datasets into smaller, more manageable groups or "buckets." Here are some benefits of bucketing:
Improved loading time, as the app will be loading only the "buckets" data instead of complete datasets;
Enhanced user experience with fewer lags and delays;
Reduced server load due to a better distribution of the processing load.
Let's imagine an application that doesn't use bucketing. Each time a user interacts with the app, it creates millions of separate events on the server. All of these are passed to the UI, which creates significant performance issues. Using bucketing categorizes data into groups, allowing the app to load only the relevant bits, making the process faster and more efficient.
Another technique is lazy loading, a design pattern of delaying the loading of resources until they are actually needed. This approach reduces the initial load time and saves system resources, significantly enhancing the responsiveness and speed of your application. You can often see this method being used in the data-driven application infrastructure.
Here are some benefits of lazy loading:
Reduced initial loading time due to the lower amount of data the app needs to start;
Saved bandwidth with data being transferred only when it's required;
Improved user experience due to the app working faster;
Reduced memory usage with fewer loading resources required.
When you build a UI for big data using lazy loading, the application will only have to deal with the page the user is currently looking at. The further they will scroll, the more information will be downloaded.
5. Integrate contextual help
You must avoid overwhelming your users with extensive and complicated features. To prevent this, you can use tooltips, onboarding tours, and detailed documentation. Providing your audience with tips and visual cues helps them get acquainted with the app.

It's necessary to use contextual help across various options to:
Improve accessibility: Tooltips provide relevant information when users encounter new UI elements, helping them understand the app's functionality and reduce the learning curve;
Facilitate onboarding: Onboarding tours highlight critical features and offer a structured path across the app's capabilities, ensuring users know how to navigate and use the app;
Provides support: Detailed documentation can help users get all information regarding data models, algorithms, visualization techniques, and other complex features;
Enhances satisfaction: Integrating contextual help directly into the UI contributes to a positive user experience, allowing to learn how to use your app quickly.
That's why integrating contextual help is crucial when creating a user interface for big data. It's a must-have feature because it helps your users to better connect with the app.
6. Design for cross-device compatibility
When you create UI designs for big data, keep in mind the differences between the various device types (like desktops and smartphones, for instance) on which users will view your app. A graph might look perfect on your 22" PC screen, but it won't be usable on a 6" smartphone.
There are several ways to ensure your big data UI design is mobile-friendly:
Use filters to allow users to limit the number of data points and focus on specific data subsets;
Add touch-friendly interactions like clickable data points, tooltips, legends, and other elements. You must increase the hit area around interactive elements to accommodate finger tapping and consider gestures like pinch-to-zoom or swipe for navigation;
Use SVGs to ensure your charts scale without losing quality, regardless of screen size or resolution.
Consider creating a custom user interface for your app's mobile version to ensure it's fully compatible with Android and iOS devices.
Real-world examples of successful user interfaces for big data
Now that you know how to build user interfaces for big data applications, let's take a look at some successful apps that have done it right:
1. Tableau
Tableau is an analytical application that utilizes almost all the tips we've discussed. This software features a strict data hierarchy, uses clear data visualization techniques, applies filters, and supports users with tooltips while still offering a good-looking UI design.
2. Google BigQuery
Google BigQuery is one of the largest data warehouse solutions that translates big data into comprehensible insights. While the software may look and feel complicated, it includes a strict hierarchy with multiple drop-down menus to simplify navigation. Users can also get support from Google's huge, detailed documentation covering all common issues.
3. PowerBi
PowerBi is a complex business analytics application that helps users visualize data in simple, interactive charts. It's a prominent example of creating an app within Microsoft's ecosystem with an effective layout and design, significantly reducing the learning curve.
Create a successful UI for your big data project with Dworkz
Dworkz is your reliable partner when it comes to designing the perfect UI for your big data project. Whether it's finance, retail, manufacturing, or data-driven healthcare transformation, our 20 years of experience ensure you'll get a perfect match for your app. We helped our clients launch hundreds of successful data-driven products with user-friendly designs beloved by customers. The average rating of 4.9/5 on Clutch speaks louder than words to prove our team's expertise.
Contact us today to discuss your project and partner with the industry's most reliable UI/UX designers to realize your big data projects.
FAQ
What are the key considerations when designing user interfaces for big data applications?
Focus on providing a user-centric design that simplifies complex datasets and supports your users on each navigation step. Also, it is necessary to choose the proper visualization methods, like standard charts, graphs, and interactive elements.
How can I optimize the performance of my user interface when dealing with massive amounts of data?
You can optimize your UI's performance by using bucketing and lazy loading. These techniques significantly reduce the application's load on your server and the user's device, which makes using your software a more pleasant experience.
How can I ensure that my user interface effectively handles large datasets?
You should constantly monitor performance metrics to see where your application is lagging. Apart from bucketing and lazy loading for technical optimization, you can try out adding filters and interactive visualizations to optimize the user experience.

