Comparing values between groups of data is fundamental, and bar charts are an essential visualization for this purpose. Use this guide to learn how to optimize this chart type!
Form and shading
When creating a bar chart, avoid adding shadows behind the bars as they do not convey any information or data, and a bar chart is not a piece of fine art.

Bars too narrow
Discrete quantities are represented by vertical bars. If the bars are too narrow, your eyes may focus on the space between the bars, which carries no information.

Let the bar stand on its own
The width of each bar should be twice the width of the space between bars.
All bars measuring the same variable in a chart should have the same color and shade.

Distracting shades
Since all bars represent the same variables, using different shades of color is irrelevant and only distracts readers from comparing the bars.

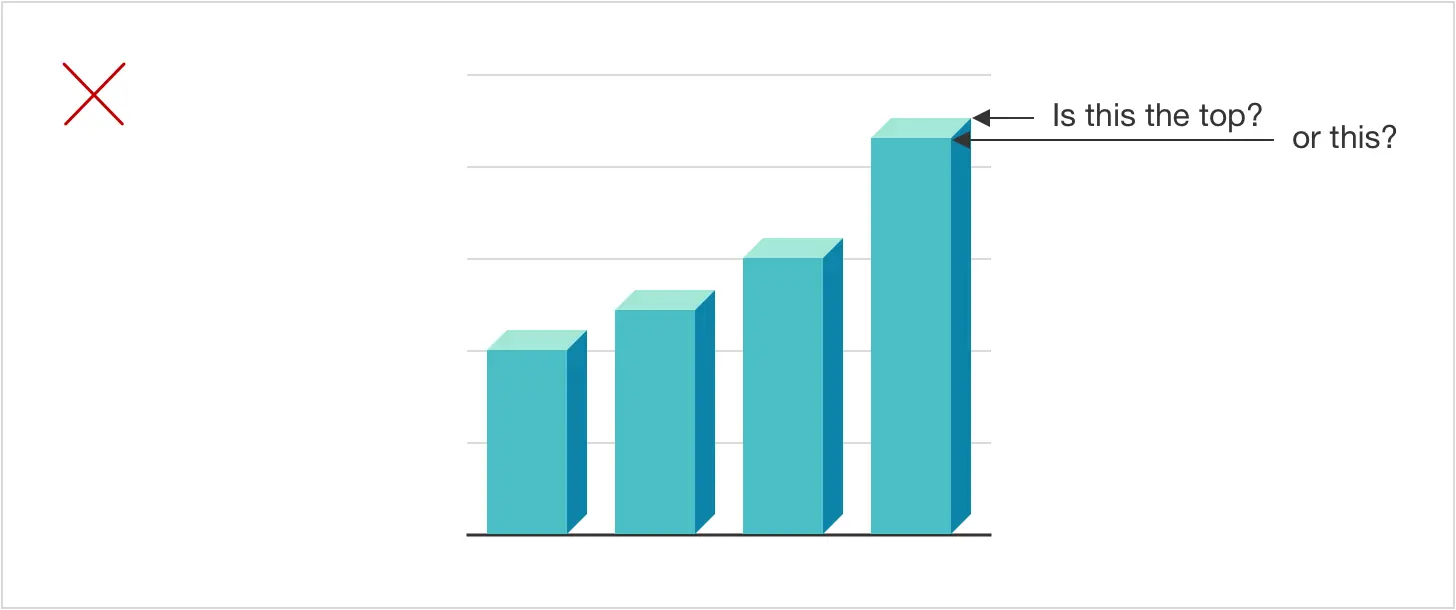
Where is the top of the bar?
Three-dimensional vertical bars are ambiguous. Rendering the bars in 3D adds no information, as the reader is left to guess where the top of the bar meets the grid.
Projections and estimates
To differentiate between actual values and projections or estimates, it's recommended to use a lighter color bar.

A gray background can be used to indicate negative values in a bar chart.

Zero baseline
Even if the bars have jagged bottoms to indicate non-zero baselines, comparing their total values is still difficult.
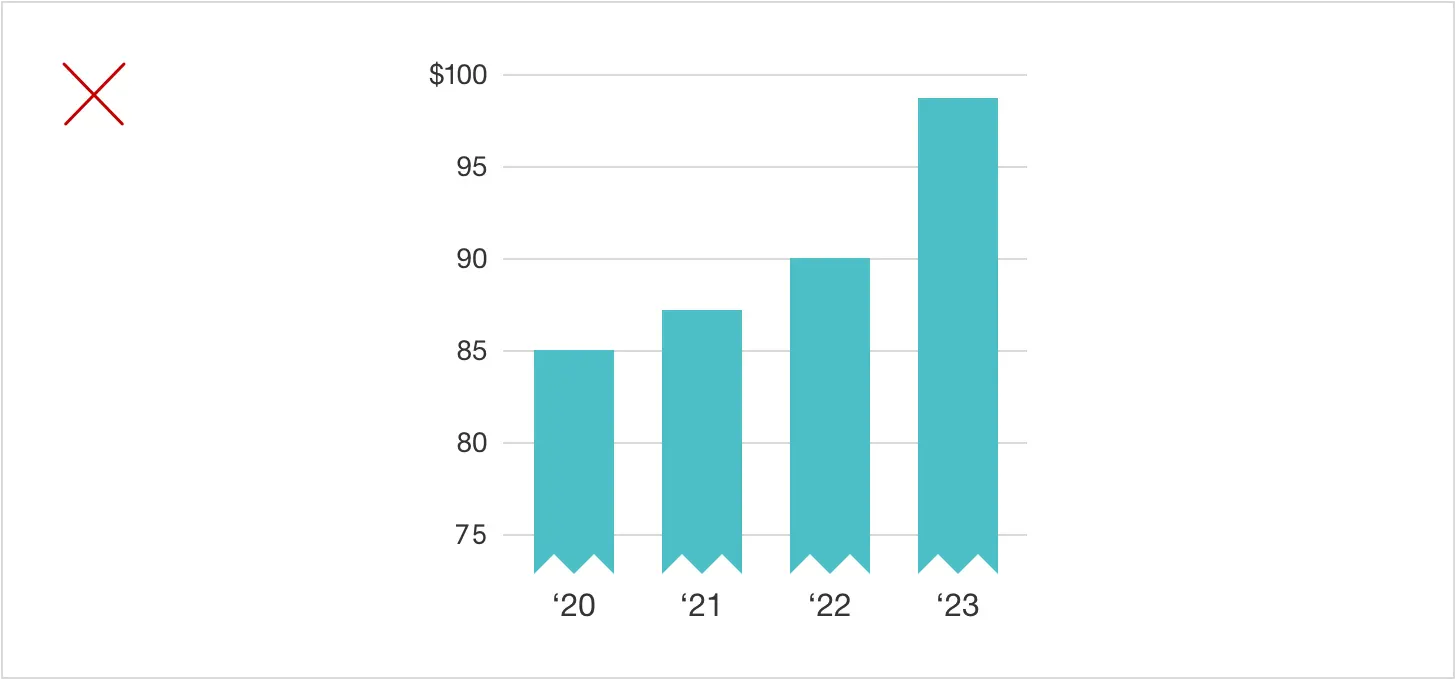
Truncation equals misrepresentation
A bar chart should always begin at zero baseline to avoid misleading truncation that obscures discrete total values and makes data comparison difficult.
The chart in the above example seems to indicate that the revenue in 2023 was five times higher than that in 2020. However, in reality, the revenue in 2023 only increased by 25% from 2020. Unfortunately, the only way for readers to know the correct figures is to calculate them, which defeats the purpose of the chart.
Make the zero baseline more prominent by drawing it thicker and heavier than the other grid lines.
When plotting a graph with vertical bars, it is important to label the value of any bar close to zero. This helps to avoid confusion and ensures that the data is accurately represented.

Always begin at the zero baseline without any exceptions!
Vertical bars are commonly used to represent discrete quantities, especially for measuring distinct sets of data over a period of time, such as revenue and income.

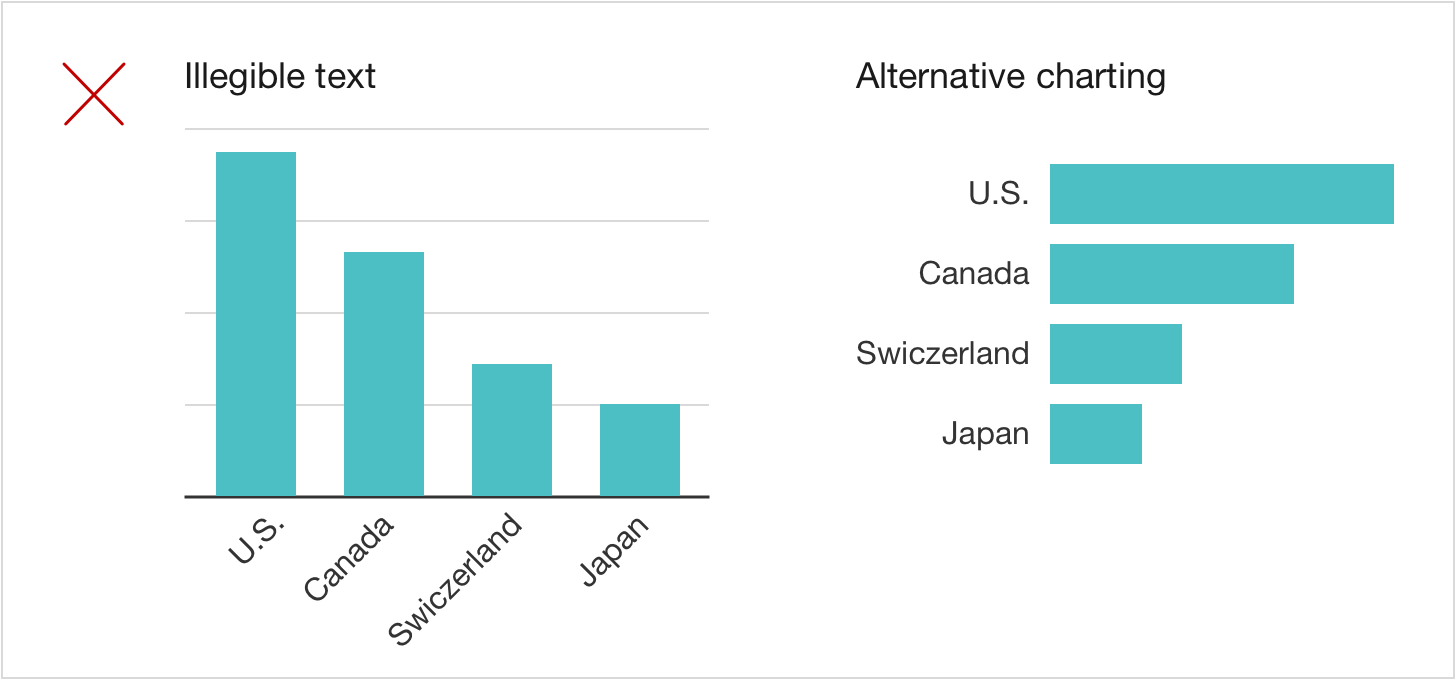
Alternative charting
If the bars are indistinguishable in height due to close data point values, consider plotting the point changes or percentage changes instead.

Multiple bars and legends
It is not recommended to label vertical bars with angled type on the x-axis. Instead, it is better to use horizontal bars to display the data.
No zebra pattern
Alternating light and dark bars are causing visual discomfort, making it difficult for the reader to compare data.

From lightest to darkest
To make it easy for comparison, the shading of the bars should be arranged from the lightest to the darkest.

No backward legend
Reordering the elements of a legend in a way that differs from the sequence of the bars can cause confusion.
A legend should not be positioned below the chart as it gives readers the key to the information.

The right sequence
A legend can be included in a multiple-bar chart to avoid cluttering the chart with labels.
The legend elements should be ordered in the same sequence as the bars for easier reference, avoiding additional work for the reader.

It is recommended that multiple-bar charts be limited to up to four categories. If there are more than five bars, it becomes difficult for the reader to visually compare and contrast them. This applies even if color is used. Using rainbow color bars can make it even more confusing.
When presenting a multiple-bar chart with three or four categories, it is advisable to use a legend to ensure a cleaner presentation, whereas using direct labeling is practical when there are only two categories.

Broken bars and outliers
Do not adjust the height of a broken bar to match the others; outliers should stand out.
Data sample is too small
Removing any data point from a data series with fewer than 12 data points is not advisable, as the sample size is too small to determine which data point is an outlier.

Values too close
It is not recommended to break a bar if its value is only about two times the next largest value. Instead, extend the scale and plot it as a regular bar.

Use broken bars sparingly

A broken bar can be used in a vertical bar chart to represent an outlier. However, before breaking a bar, it is important to confirm...
✅ The data source has provided the accurate value for the outlier.
✅ There are a minimum of ten bars and only one value that falls significantly outside the expected range of the other values.
✅ The largest value is at least three times larger than any other.
✅ The data point representing last year's exceptional performance should not be diminished by using a broken bar.

Choose a y-axis scale that accommodates all bars except the outlier.
Make sure to label the broken bar's data points always.
Summary
When depicting information segments, bar charts are often the most suitable option. Vertical bar charts are particularly effective for comparing distinct categorical or discrete variables, such as revenue, profit, or age groups, provided that there are not too many categories to compare. They are also highly useful for time series data. The x-axis labels have limited space but are perfect for displaying years, minutes, hours, or months.
Vertical bar charts are ideal for highlighting changes in magnitude, particularly when presenting data that describes components, frequency distribution, and time-series statistics.
The following article from the Data Visualization series will discuss horizontal bars in charts. Stay tuned and subscribe to our mailing list to ensure you get the following article on data visualization.
If you missed the previous four articles from the series, you can read them here: